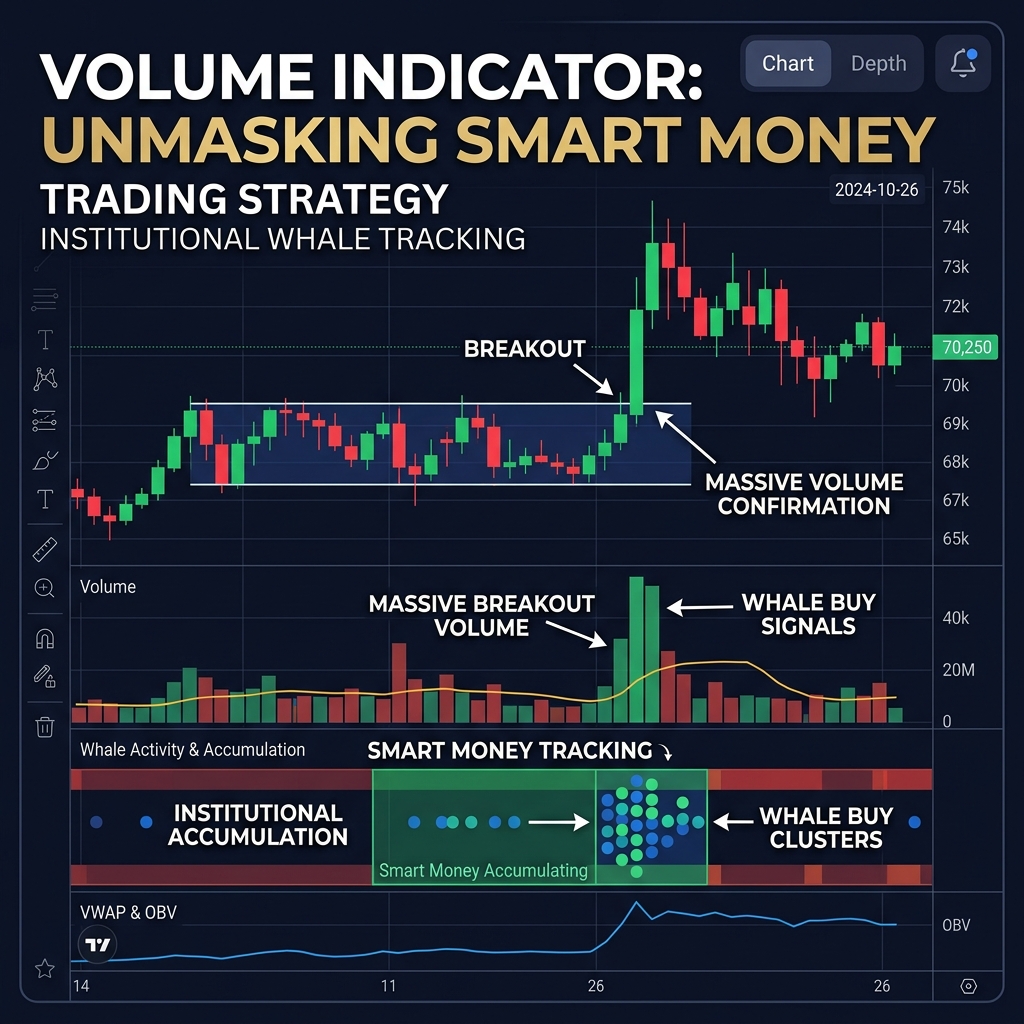
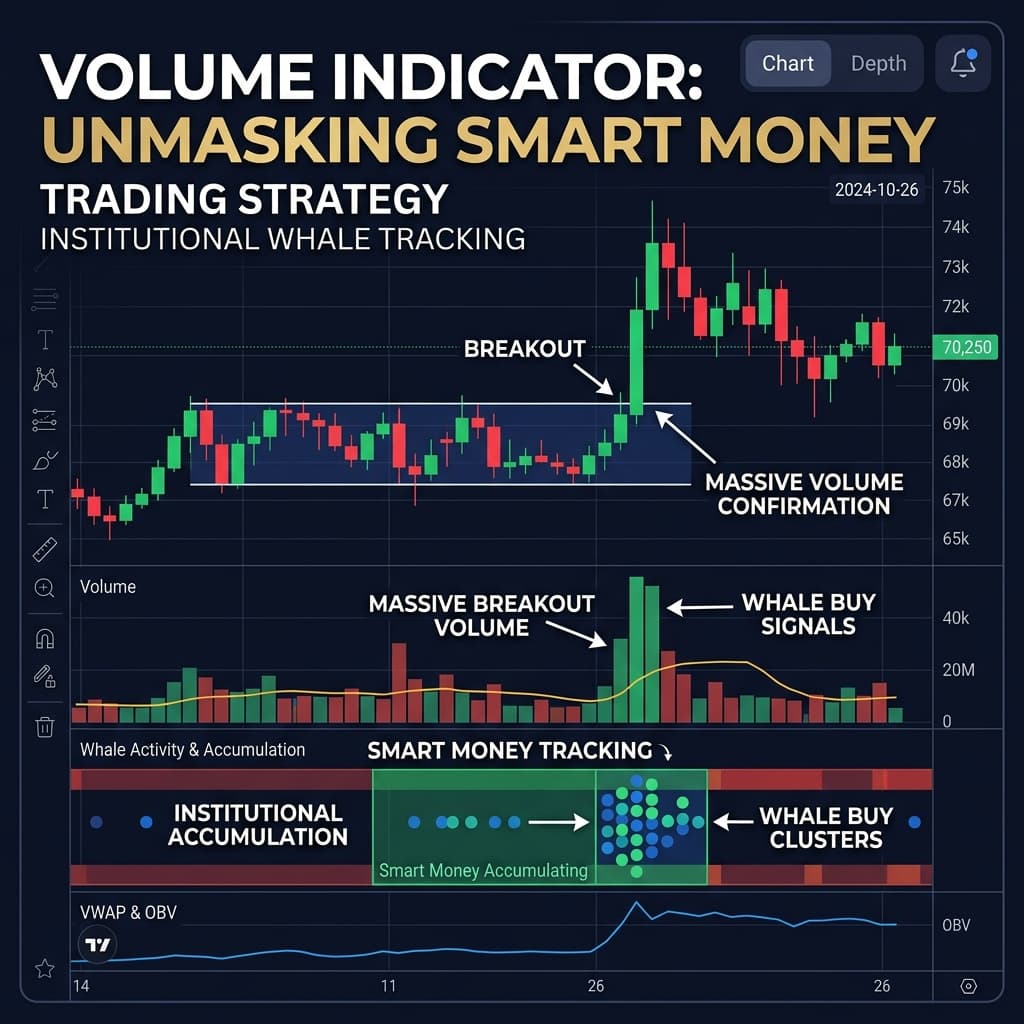
Volume Indicator: How to Track Smart Money (English Guide)
C
Crypto Gyan Hub Team
Crypto Analyst
Important Regulatory Disclaimer (VDA & Crypto Risk Notice)
Section 115BBH ActiveCryptocurrency products and NFTs are unregulated and can be highly risky. There may be no regulatory recourse for any loss from such transactions. Crypto Gyan Hub does not provide personal investment or legal tax advice. Always consult a certified Chartered Accountant before trading or filing taxes.
Affiliate Disclosure: Some tools and exchange links on this portal may be sponsored or partner affiliate links (e.g., KoinX, CoinDCX, Ledger). We may earn a small commission at no extra cost to you when you use our links. This helps keep our educational platform 100% free!
Top High-Ticket Masterclass • VIP FunnelVerified Institutional Research
Keystone Investors Club – 2026 Crypto Research & Early Gem Masterclass!
Discover the exact portfolio rebalancing strategies and low-cap altcoin research used by top global institutions. Watch the exclusive Interview-24 presentation now.
Table of Contents (Quick Navigation)
- • What is a Volume Indicator?
- • Basic Rules of Volume
- • Types of Volume and Indicators
- • 1. Basic Volume Bars
- • 2. OBV (On-Balance Volume)
- • 3. Volume Profile
- • 4. VWAP (Volume Weighted Average Price)
- • Volume Trading Strategies
- • Strategy 1: Volume Breakout Confirmation
- • Strategy 2: Smart Money Accumulation Detection
- • Strategy 3: Climax Volume (Reversal Signal)
- • Volume + Other Indicators Combination
- • FAQs
- • Q1. How much volume is considered "high"?
- • Q2. Is the volume on crypto exchanges accurate?
- • Q3. What is the best use of the OBV indicator?
- • Conclusion
- • 📖 Related Recommended Reading: