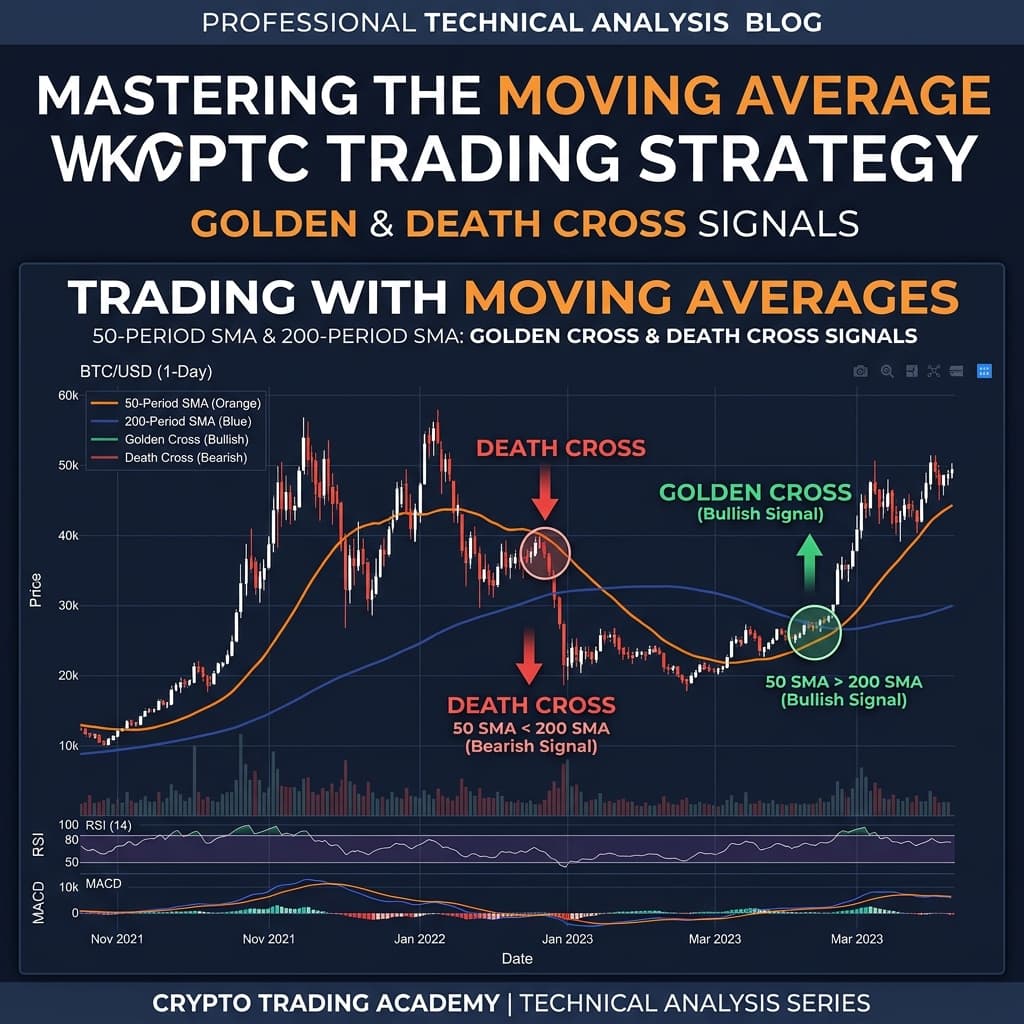
Moving Average (MA) is the most basic yet most important technical indicator. It filters out price noise to create a smooth line that clearly shows the trend direction.
If you are new to trading, learning about Moving Averages should be your first step.
📊 Check Live Chart: Live Moving Average levels for Bitcoin and Ethereum — Live Crypto Prices Tool
1. SMA — Simple Moving Average
Formula: SMA = Sum of Closing Prices / Number of Periods
Example: 10-day SMA = Average of the closing prices of the last 10 days
| Calculation | Simple arithmetic mean |
| Lag | Higher lag |
| Smoothness | Very smooth |
| Best For | Long-term trend identification |
2. EMA — Exponential Moving Average
EMA gives more weight to recent prices. This means that when the price changes, the EMA reacts much faster.
| Calculation | Weighted — recent prices more important |
| Lag | Lower lag |
| Sensitivity | Highly sensitive |
| Best For | Short to medium term trading |
| 9 / 10 EMA | Fast MA | Scalping, short-term signals |
| 20 EMA | Short-term | Swing trading, 20-day trend |
| 50 SMA | Mid-term | Trend identification |
| 100 SMA | Long-term | Major support/resistance |
| 200 SMA | Very Long-term | Bull/Bear market separator |
Golden Cross and Death Cross — Most Famous Signals
✅ Golden Cross (Strong BUY Signal)
- 50 SMA crosses ABOVE 200 SMA
- Historically a very bullish signal
- Whenever Bitcoin has given a Golden Cross, a significant rally has followed
❌ Death Cross (Strong SELL Signal)
- 50 SMA crosses BELOW 200 SMA
- Bearish signal — indicates the start of a downtrend
- Bitcoin dropped 70%+ after the Death Cross in 2022
Strategy 1: Price vs 200 SMA (The Simplest Rule)
The Golden Rule:
- Price above the 200 SMA → Take BUY opportunities only
- Price below the 200 SMA → Take SELL/Short opportunities only
Following such a simple rule prevents you from trading against the major trend.
Strategy 2: EMA Crossover (Swing Trading)
Fast EMA (9) + Slow EMA (21) Crossover:
| 9 EMA crosses above 21 EMA | BUY — Bullish momentum |
| 9 EMA crosses below 21 EMA | SELL — Bearish momentum |
Best Setup: Use on Daily or 4H charts.
Strategy 3: MA Ribbon (Multiple MAs)
Use 5 EMAs together: 8, 13, 21, 34, 55
- Ribbons fan out upward + price above all → Strong Bullish trend
- Ribbons fan out downward + price below all → Strong Bearish trend
- Ribbons tangled/flat → Choppy market — avoid
Strategy 4: Moving Average Bounce (Trend Following)
In a strong uptrend, the 20 EMA or 50 SMA provides pullback entries:
- Confirm the uptrend (Higher Highs + Higher Lows)
- Price pulls back to the 20 EMA
- Find support at the 20 EMA + bullish candle forms
- BUY — Stop Loss below the 20 EMA
- Target: Previous high
| Long-term trend analysis | SMA (50, 200) |
| Intraday/Short-term trading | EMA (9, 20, 21) |
| Golden/Death Cross | SMA |
| Dynamic support/resistance | EMA 20 or 50 |
Professional advice: Use both — EMA for short-term signals, SMA for long-term context.
These MA levels are very important in crypto:
| 200 SMA (Daily) | Bull/Bear market divider |
| 50 SMA (Daily) | Medium-term support in bull market |
| 20 EMA (Daily) | Short-term trend support |
| 200 EMA (Weekly) | Very long-term macro support |
Bitcoin has formed a bottom at the 200-week MA multiple times — this is a crucial level for long-term investors.
⚖️ Exchange Compare: Best exchange to trade SMA/EMA strategy — Compare Tool
❌ Too Many MAs: Applying 6-7 MAs together clutters the chart. Use a maximum of 2-3.
❌ Wrong Period Selection: The 200 SMA is not very useful on a 5-minute chart. Select the MA period based on the timeframe.
❌ Blind Entry on MA Crossover: Moving average crossovers lag. Volume and candlestick confirmation are essential.
Q1. Is Moving Average a lagging indicator?
Yes, MA is a lagging indicator because it uses past data. However, it is the most reliable tool for trend identification.
Q2. Which MA is best for crypto?
EMA is more popular in crypto because it reacts faster. The combination of the 20 EMA and 200 SMA is widely used.
Q3. How reliable is a Golden Cross signal?
Historically, the Golden Cross has been very reliable for long-term investment in Bitcoin and major cryptos. There might be some delay for short-term traders.
Q4. What is the difference between MAs and Bollinger Bands?
The middle band of Bollinger Bands is simply a 20-period SMA, but it also includes volatility bands. MAs show only the trend, while BB shows volatility as well.
Moving Average is the foundation of trading:
- ✅ 200 SMA clearly identifies the Bull/Bear market
- ✅ Golden Cross/Death Cross are powerful long-term signals
- ✅ EMA bounce provides reliable entries in trending markets
- ✅ Simple and beginner-friendly, yet used daily by professionals
Final Tip: Make the 200 SMA your compass. Until you see a clear trend, do not take excessive trades.
⚠️ Disclaimer: Educational content only. Trading involves risk — be sure to do your own research.
🧮 Interactive Tools: Try our free Crypto Tax Calculator and Crypto SIP Calculator for your portfolio calculations and tax estimations.