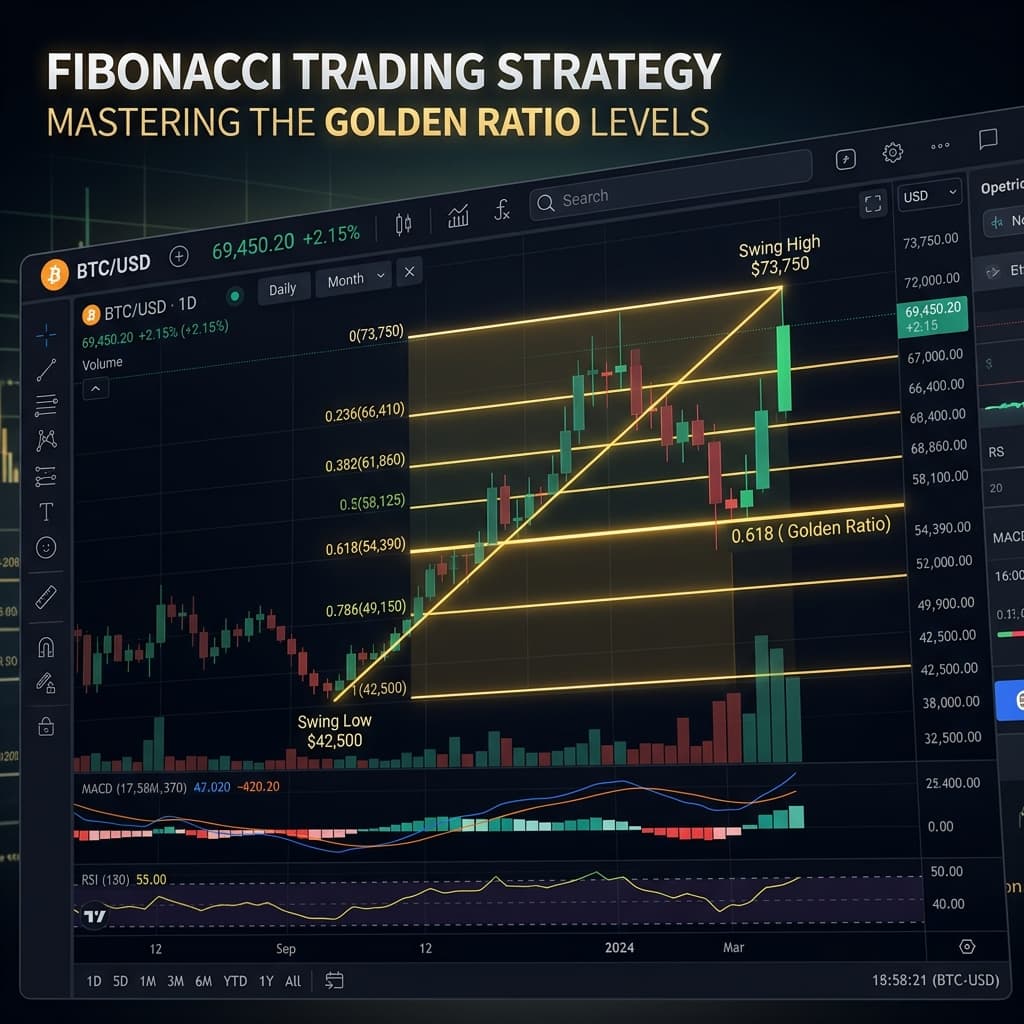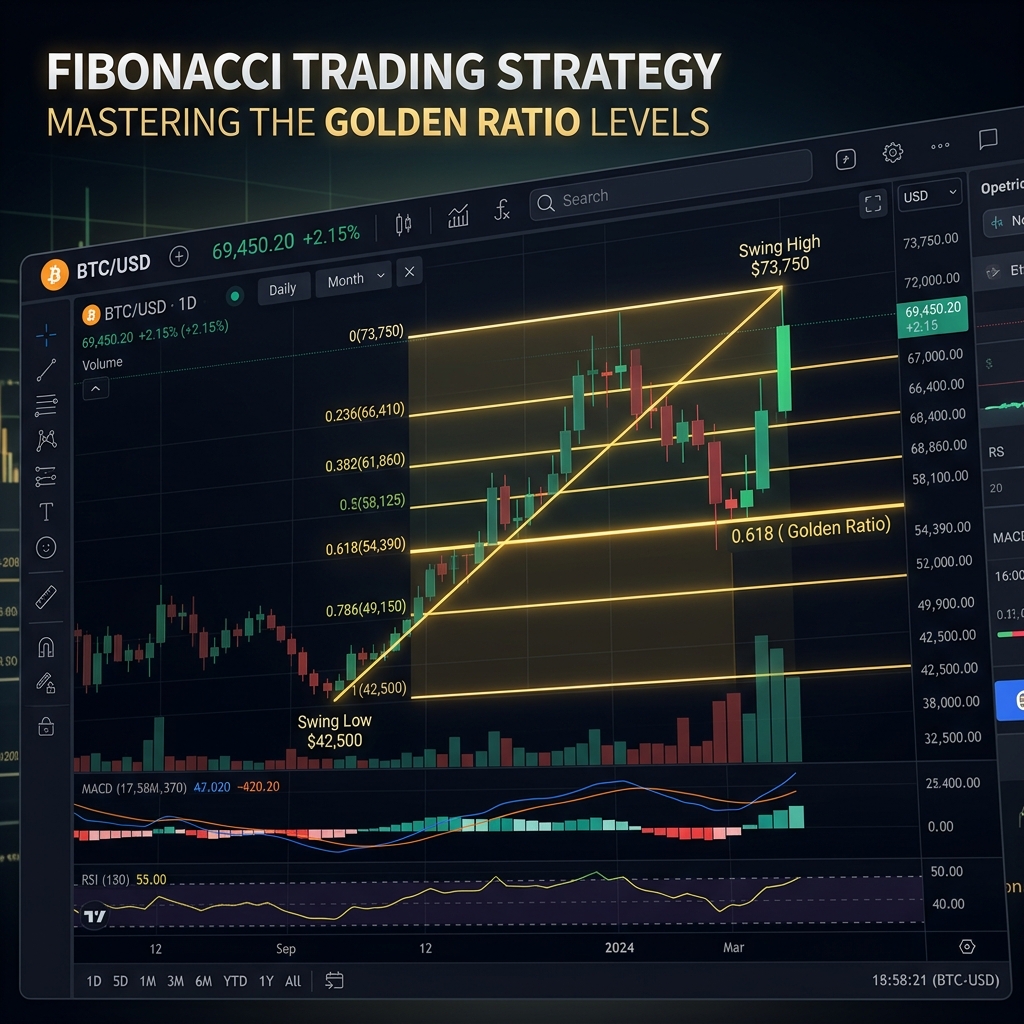
Fibonacci Retracement is a popular technical analysis tool created from the ratios of the naturally occurring Fibonacci sequence. These levels predict how much a price might retrace after a move and where it will bounce back from.
Leonardo Fibonacci's Golden Ratio (0.618) is found everywhere in nature — sunflower seeds, galaxy spirals, and yes — in financial markets as well!
| 23.6% | Shallow retracement — In a strong trend |
| 38.2% | Moderate retracement — Common bounce zone |
| 50.0% | Psychological mid-point (Not a Fibonacci ratio, but important) |
| 61.8% | Golden Ratio — The most important level |
| 78.6% | Deep retracement — Last line of defense |
The 61.8% level is called the "Golden Ratio" — it is the most powerful support and resistance level.
In a Bullish Move:
- Identify the Swing Low (the lowest point)
- Identify the Swing High (highest point)
- Drag the tool from Low to High
- Levels will be plotted automatically
In a Bearish Move:
- Draw from Swing High to Swing Low
- The levels will act as resistance from bottom to top
Strategy 1: 61.8% Golden Ratio Bounce
- Price pulls back in a strong uptrend
- Expect support at the 61.8% Fibonacci level
- A bullish candle forms at that level
- RSI bounces from the oversold zone
- BUY — Stop Loss below 78.6%
- Target: Previous high (100% level)
Strategy 2: Fibonacci + Moving Average Confluence
When a Fibonacci level and a Moving Average are at the same spot — known as a Confluence Zone — it creates very strong support and resistance.
Example:
- 38.2% Fibonacci level = 50-day SMA is also at the same price
- This zone will act as very strong support → High-probability BUY
Strategy 3: Fibonacci Extension (Profit Targets)
Fibonacci levels show not only retracements but also extensions:
| 127.2% | Conservative target |
| 161.8% | Standard target |
| 261.8% | Aggressive target |
🧮 Calculate ROI: Calculate your expected profit using the Fibonacci target — Profit Calculator
Fibonacci levels are more reliable when other factors align with them:
- Confluence with a Support/Resistance level
- Confluence with a Moving Average (50 SMA, 200 SMA)
- High volume node of the Volume Profile
- Touch of a Trendline
- Cluster of Previous candle wicks
The more confirmations you have, the stronger the expected bounce!
❌ Mistake 1: Selecting Wrong Swing Points
Choosing the wrong high or low makes all levels incorrect. Always use the most significant swing points.
❌ Mistake 2: Depending Solely on Fibonacci
Fibonacci is a tool, not a "magic formula." Always seek additional confirmation.
❌ Mistake 3: Trading All Levels
The most important levels are: 38.2%, 50%, and 61.8%. Focus on these three.
Q1. Why do Fibonacci levels work?
Because traders worldwide are watching them and buying/selling around them — acting like a self-fulfilling prophecy.
Q2. What is the relation between Fibonacci and Elliott Wave?
Elliott Wave Theory is based on Fibonacci ratios. Wave targets and corrections are measured using Fibonacci levels.
Q3. How accurate is Fibonacci in crypto?
Bitcoin and Ethereum have bounced perfectly off the 61.8% and 38.2% levels many times. Its historical record is very strong.
Fibonacci Retracement is a powerful tool that:
- Provides entry points during pullbacks
- Identifies strong support/resistance zones
- Helps set profit targets
- Becomes exceptionally accurate when combined with confluence
⚠️ Disclaimer: Educational only. Trade after doing your own research.
🧮 Interactive Tools: Try our free Crypto Tax Calculator and Crypto SIP Calculator for your portfolio calculations and tax estimations.