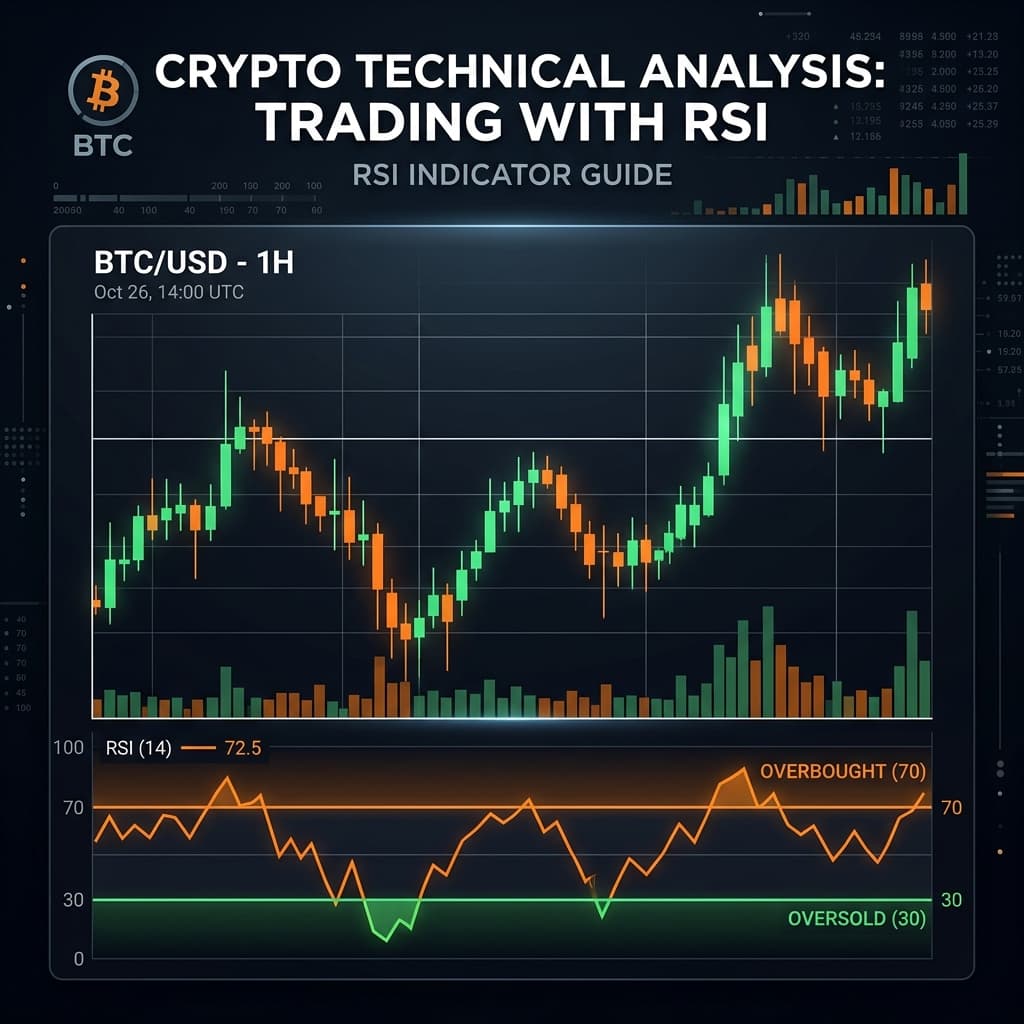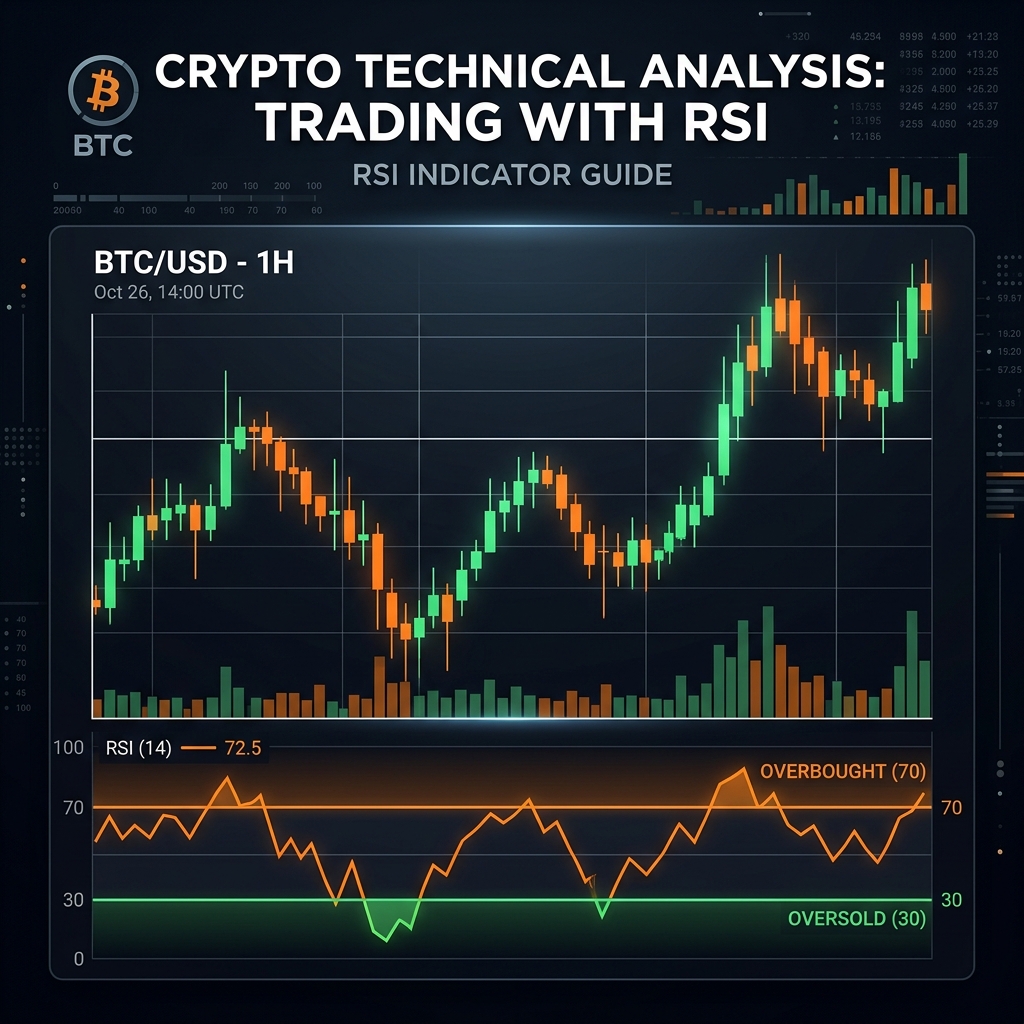
RSI (Relative Strength Index) is a momentum oscillator developed by J. Welles Wilder in 1978. It displays a value between 0 and 100, which indicates whether an asset is overbought (greatly overpriced) or oversold (greatly underpriced).
RSI remains the top choice indicator for traders worldwide because it is both simple and accurate.
📈 Check Live RSI: To view the live RSI value of any cryptocurrency, use the Live Crypto Prices Tool.
The RSI formula is simple:
RSI = 100 − [100 / (1 + RS)]
Where RS = Average Gain / Average Loss (over the last 14 periods)
The default setting is 14 periods — meaning RSI calculates the ratio of upward/downward moves over the past 14 candles.
| Above 70 | Overbought — May drop |
| Below 30 | Oversold — May rise |
| Near 50 | Neutral zone |
| Above 50 | Bullish trend |
| Below 50 | Bearish trend |
4 Main RSI Trading Signals
Signal 1: Overbought/Oversold Zones
Oversold Signal (BUY):
- RSI drops below 30
- Price has experienced a significant drop
- RSI comes back above 30 from there → Time to take an entry
Overbought Signal (SELL/Exit):
- RSI goes above 70
- Price has pumped significantly
- RSI comes below 70 → Time to exit or short
⚠️ Important: Do not buy/sell solely by looking at RSI overbought/oversold levels. In a strong trend, RSI can stay in the extreme zone for an extended period!
Signal 2: RSI Centerline Crossover
- RSI crosses above 50 → Bullish momentum starts
- RSI crosses below 50 → Bearish momentum starts
This acts as a trend-following entry for swing traders.
Signal 3: RSI Divergence (Most Powerful)
Bullish Divergence:
- On the chart: Price makes a new lower low
- On the RSI: Higher low is formed (RSI did not go lower)
- Meaning: Bearish momentum is weakening → Reversal possible
Bearish Divergence:
- On the chart: Price makes a new higher high
- On the RSI: Lower high is formed
- Meaning: Bullish momentum is fatigued → A drop may occur
Signal 4: RSI Failure Swing (Advanced)
Bullish Failure Swing:
- RSI drops below 30 (oversold)
- RSI comes back above 30
- RSI pulls back but stays above 30
- RSI breaks its previous high → Strong BUY signal
Strategy 1: RSI + Support/Resistance (Best for Beginners)
Rules:
- Identify a major support level on the chart
- Price approaches that support
- RSI is in the 30-40 zone (oversold or near-oversold)
- A bullish candle is confirmed → BUY entry
- Stop Loss: Slightly below the support
- Target: Next resistance level
Strategy 2: RSI + Moving Average (Trend Following)
| Price above 200 EMA + RSI drops below 50 and bounces | BUY (pullback entry) |
| Price below 200 EMA + RSI rises above 50 and gets rejected | SELL (short entry) |
Strategy 3: RSI Divergence + Candlestick Pattern
- RSI Bullish Divergence is visible
- Accompanied by a Hammer, Doji, or Engulfing bullish candle
- Both are confirmed → High-probability BUY
🧮 SIP Calculator: Calculate returns on crypto SIPs every month — Crypto SIP Calculator
| Conservative | RSI(14), OB:80, OS:20 | Strong trend confirmation |
| Standard | RSI(14), OB:70, OS:30 | General trading |
| Aggressive | RSI(7), OB:70, OS:30 | Scalping, Short-term |
Crypto has higher volatility, which is why RSI(14) with 70/30 is the best combination.
Advantages and Disadvantages of RSI
✅ Advantages:
- Simple and easy to understand
- Can catch reversals early using divergence
- Works on any timeframe
- Indicates both trend and momentum
❌ Disadvantages:
- Can remain in extreme zones for extended periods during strong trends
- Lagging indicator — has some delay
- May give false signals if used in isolation
Q1. What is the best timeframe for RSI?
RSI is most reliable on Daily (1D) and 4H charts. Scalpers can use 15-min or 1H.
Q2. How important is the RSI 50 cross?
Very important! Crossing the RSI 50 centerline provides an early signal of a trend change — experienced traders watch this closely.
Q3. Can RSI and MACD be used together?
Yes! This combination is very powerful. When both indicators give signals in the same direction, the entry probability increases significantly.
Q4. How accurate is RSI divergence?
Under the right conditions, RSI divergence is 60-70% accurate. However, always use it with another confirmation (volume, pattern).
RSI is an all-time favorite indicator useful for traders at every level:
- Beginners: Take simple entries using overbought/oversold levels
- Intermediate: Use centerline crossovers and divergences
- Advanced: Perform failure swings and multi-timeframe RSI analysis
Golden Rule: Instead of using RSI alone, always combine it with price action, support/resistance, and another indicator.
⚠️ Disclaimer: This article is for educational purposes only. Trading involves risk, make sure to do your own research.
💡 Related Masterclass: Behtar confirmation aur trend direction samajhne ke liye hamara Moving Average (SMA & EMA) Trading Strategy Guide zaroor padhein.
🧮 Interactive Tools: Try our free Crypto Tax Calculator and Crypto SIP Calculator for your portfolio calculations and tax estimations.