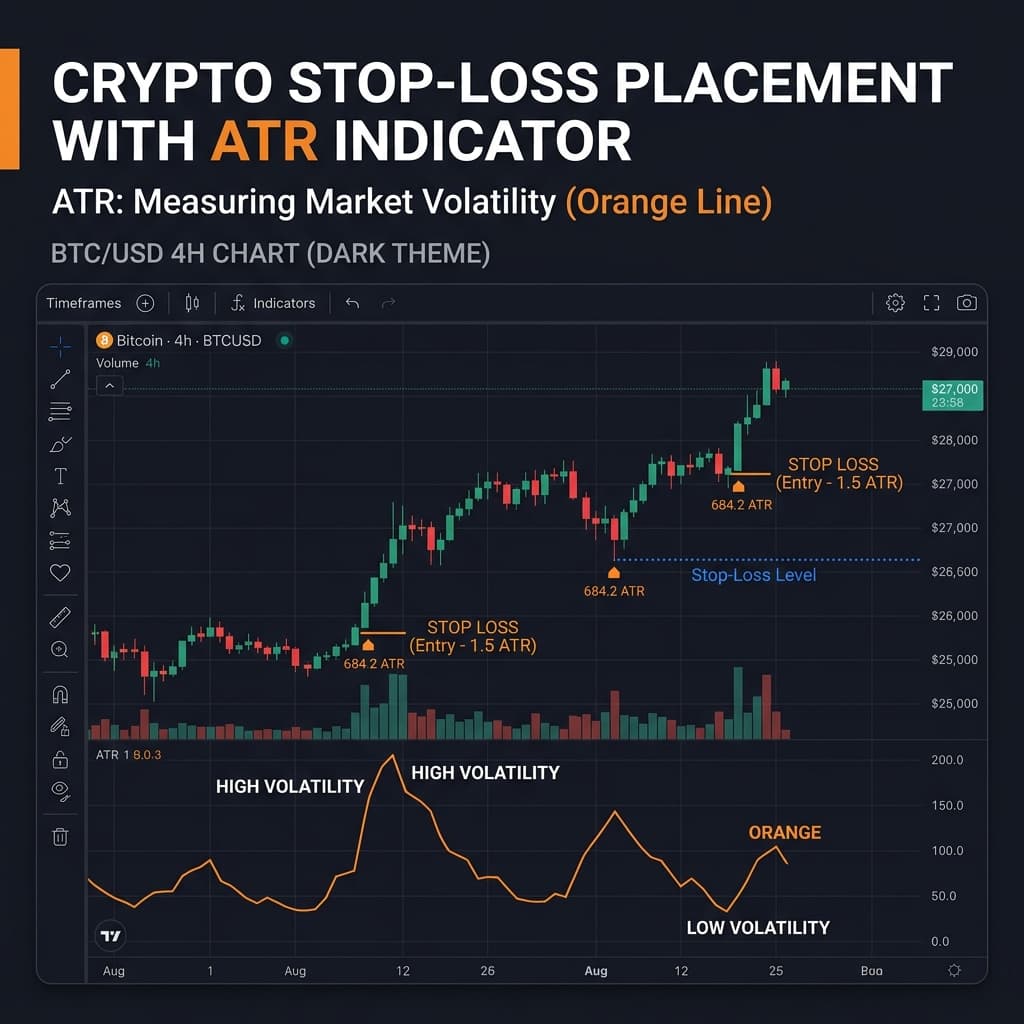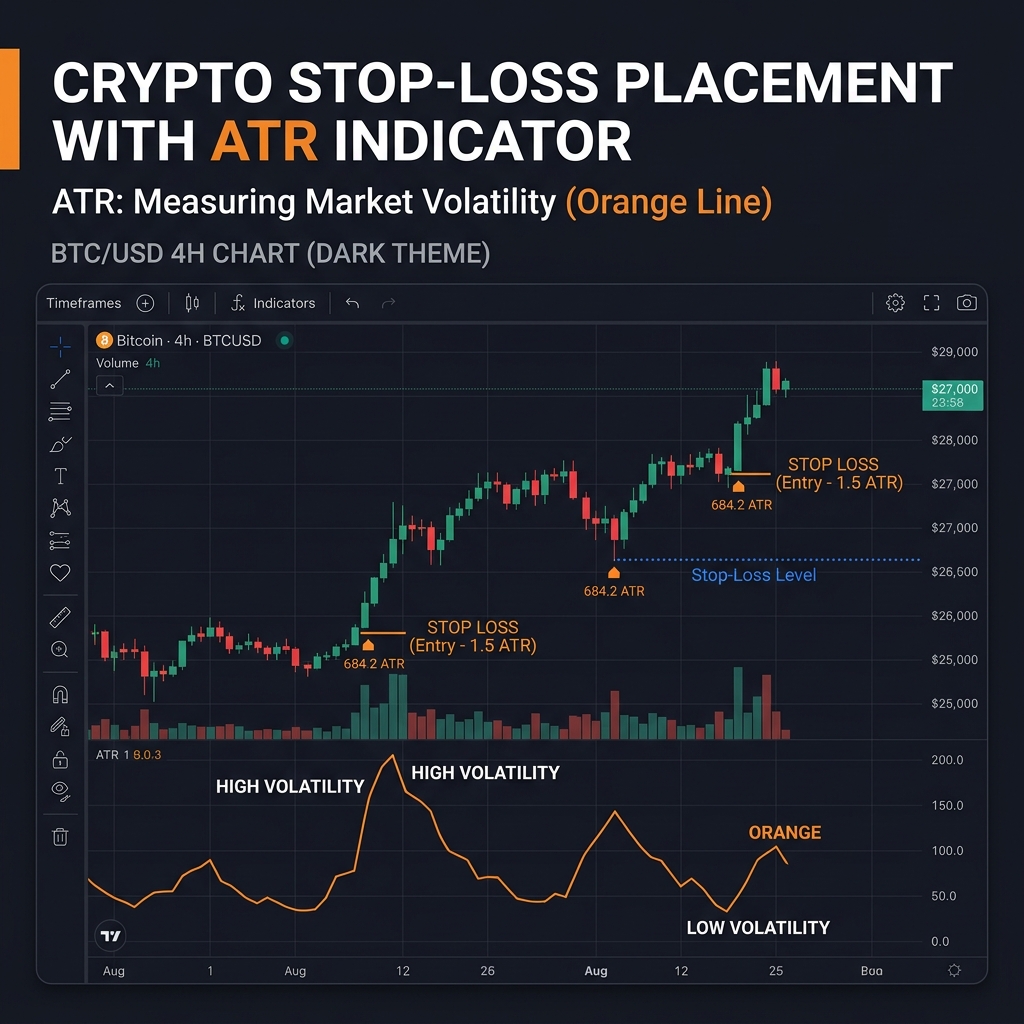
ATR (Average True Range) is a volatility indicator developed by J. Welles Wilder — the same person who created the RSI. ATR tells you how much an asset moves on average over a specific period (in pips, points, or percentages).
ATR does not indicate direction (Bullish or Bearish), it only shows volatility — how much movement can be expected.
💡 Key Insight: The most powerful use of ATR is stop loss placement. Instead of setting random stop losses, an ATR-based stop loss is scientifically accurate.
True Range (TR):
TR = Maximum of:
- High − Low (candle range)
- |High − Previous Close|
- |Low − Previous Close|
ATR = 14-period average of True Range
Default setting: 14 periods
| ATR High (spike) | High volatility — Large moves expected |
| ATR Low | Low volatility — Range-bound market |
| ATR Rising | Volatility is increasing |
| ATR Falling | Volatility is decreasing |
Use Case 1: ATR-Based Stop Loss (Most Important)
Formula: Stop Loss = Entry Price − (ATR × Multiplier)
Common Multipliers:
- Conservative: 1.5× ATR
- Standard: 2× ATR
- Wide: 3× ATR
Example:
- Bitcoin price: ₹50,00,000
- 14-period ATR: ₹80,000
- 2× ATR Stop Loss: ₹50,00,000 − ₹1,60,000 = ₹48,40,000
This stop loss is based on actual market volatility — neither too tight nor too wide.
Use Case 2: ATR for Position Sizing
With ATR, you can decide how much to invest:
Formula: Position Size = (Risk Per Trade) / (ATR × Multiplier)
If you want to take a 1% risk per trade and the ATR is ₹80,000:
- 2% capital = ₹10,000 risk
- Position = ₹10,000 / ₹1,60,000 = roughly 0.0625 BTC
Use Case 3: Profit Target Setting
- Set realistic profit targets using ATR
- If the ATR is ₹80,000, a ₹10,000 target is unrealistic
- Set a minimum target of 2-3× ATR for a good R:R ratio
Use Case 4: Volatility Filter
- During low ATR periods: Avoid breakout strategies (false breakouts)
- During high ATR periods: Be more cautious, reduce position size
- On an ATR spike: A large move has already occurred — do not chase it
Strategy 1: ATR Trailing Stop Loss
Use a trailing stop loss when a trade is profitable:
- Enter the trade
- Stop Loss = Current Price − 2× ATR
- As the price moves, move your stop loss accordingly (upward only)
- Hold the position until the stop is hit
This strategy is best for riding big trends.
Strategy 2: ATR Channel Breakout
- Upper Channel = 20-day High + ATR
- Lower Channel = 20-day Low − ATR
- Price breaks Upper Channel → BUY
- Price breaks Lower Channel → SELL/SHORT
Strategy 3: ATR + Bollinger Bands Combo
- ATR rising + Bollinger Squeeze → Explosive move coming
- Use MACD or Volume to determine direction
- Enter on the breakout with an ATR-based stop loss
🧮 Profit Calculator: Calculate your profits by setting ATR targets — Profit Calculator
❌ Trading using only ATR — ATR does not show direction, so always use a trend/momentum indicator alongside it.
❌ Ignoring ATR — Setting random stop losses without ATR either makes them too tight (getting stopped out) or too wide (taking excessive losses).
Q1. What period should be used for ATR?
The standard 14 period is the most common. Short-term traders can use a 7-period setting.
Q2. What if I want to view ATR in percentage?
ATR% = (ATR / Current Price) × 100 — this is useful for comparing different assets.
Q3. Does ATR reveal market direction?
No. ATR only shows volatility — use MACD, RSI, or price action for direction.
ATR is a cornerstone of risk management:
- ✅ Scientific stop loss placement
- ✅ Accurate position sizing
- ✅ Realistic profit targets
- ✅ Volatility filter for trade selection
Every trader should understand ATR — it is not a beginner tool, but a daily weapon for professionals.
⚠️ Disclaimer: Educational content only. Trading involves risk.
🧮 Interactive Tools: Try our free Crypto Tax Calculator and Crypto SIP Calculator for your portfolio calculations and tax estimations.