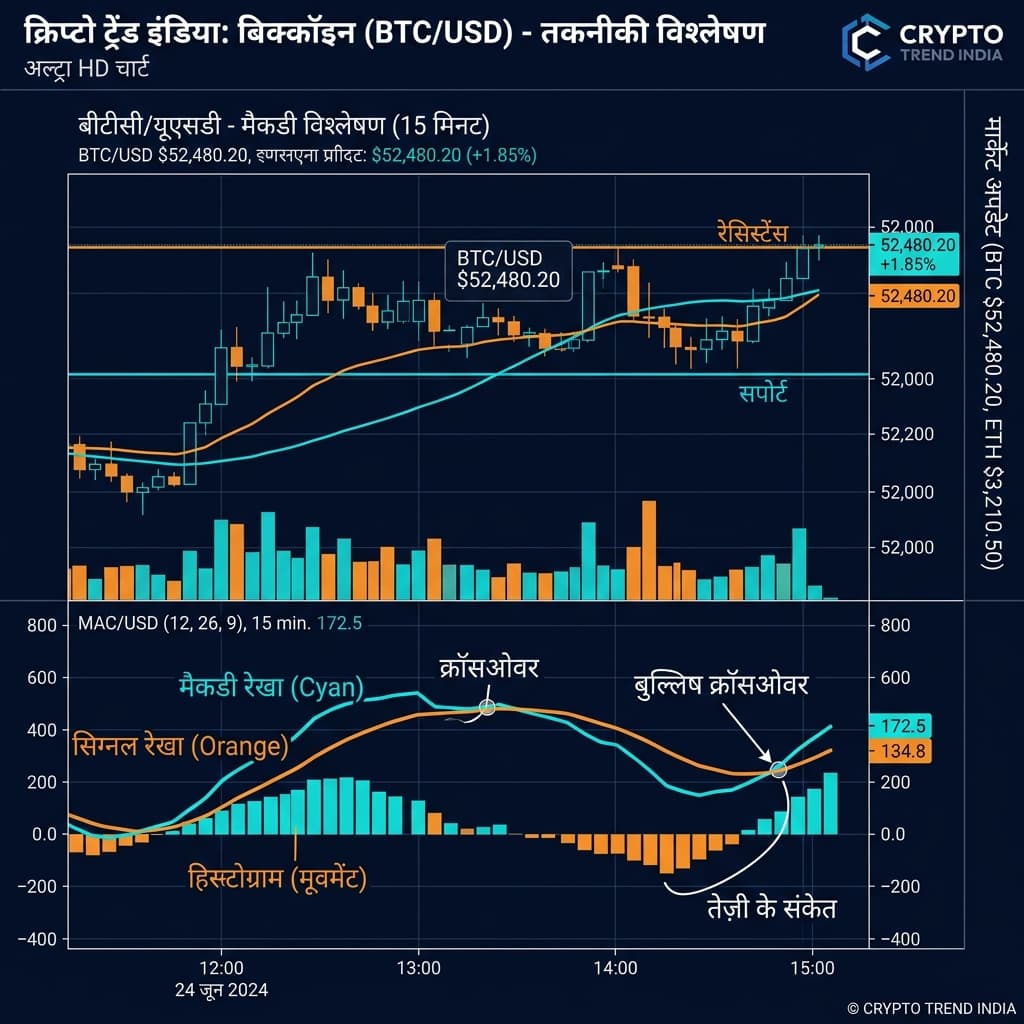
MACD (Moving Average Convergence Divergence) is a powerful technical indicator developed by Gerald Appel in the 1970s. Today, it is one of the most widely used trading indicators in the world — whether you trade Bitcoin, Ethereum, or any Altcoin.
MACD works like a tool that lets you do two things simultaneously:
- Understand the trend direction (Bullish or Bearish)
- Measure momentum (how fast the trend is moving)
📊 Check Live Charts: Use our Live Crypto Prices Tool to see real-time MACD signals.
The 3 Main Components of MACD
MACD is not just a single line — it has three parts that are important to understand:
1. MACD Line (Fast Line)
This is the difference between the 12-period EMA and the 26-period EMA.
Formula: MACD Line = 12 EMA − 26 EMA
When the MACD line is positive, it means short-term prices are above long-term prices (Bullish). When it is negative, it indicates a Bearish trend.
2. Signal Line (Slow Line)
This is the 9-period EMA of the MACD Line. It is a smoother line that generates trading signals. When the MACD Line crosses the Signal Line, it provides an entry or exit signal.
3. Histogram (Bar Chart)
This displays the difference between the MACD Line and the Signal Line in the form of a bar chart.
- Green bars (above): Bullish momentum is increasing
- Red bars (below): Bearish momentum is increasing
- Bars are getting smaller: Trend is weakening — reversal possible
| Default (Gerald Appel) | 12, 26, 9 | Swing Trading, Daily Charts |
| Fast Settings | 5, 13, 6 | Scalping, 15-min charts |
| Slow Settings | 19, 39, 9 | Long-term position trading |
For beginners, the default 12-26-9 settings are the best. Customize them after gaining experience.
Signal 1: MACD Crossover (Most Popular Signal)
Bullish Crossover (BUY Signal):
- MACD Line crosses above the Signal Line from below
- Especially if this crossover happens below the zero line, the signal is very strong
Bearish Crossover (SELL Signal):
- MACD Line crosses below the Signal Line from above
- This crossover is more reliable above the zero line
Signal 2: Zero Line Crossover
| MACD Line went above zero | Bullish — Buy |
| MACD Line went below zero | Bearish — Sell/Avoid |
Signal 3: MACD Divergence (Advanced — Very Powerful)
Divergence occurs when the price and the MACD indicator move in opposite directions.
Bullish Divergence:
- Price formed a lower low (went down)
- But MACD formed a higher low (from below)
- This means selling pressure is decreasing → Reversal is coming (BUY)
Bearish Divergence:
- Price formed a higher high
- MACD formed a lower high
- This means buying pressure is weak → Price is about to fall (SELL)
🧮 Calculate Profit: After taking an entry based on a MACD signal, calculate your expected profit using the Profit Calculator.
Strategy 1: Simple Crossover Strategy (Beginners)
Rules:
- Open a Daily or 4H chart
- Add the MACD indicator (12, 26, 9)
- When the MACD Line crosses the Signal Line from below → BUY
- Stop Loss: Below the recent swing low
- Target: 2:1 Risk-Reward ratio
Use both MACD and RSI together for confirmation:
| MACD Bullish crossover + RSI coming up from below 30 | Strong BUY |
| MACD Bearish crossover + RSI going down from above 70 | Strong SELL |
| Only MACD crossover, RSI not confirming | Wait |
Strategy 3: Histogram Shrinkage Strategy (Advanced)
- Be in a Bullish trend (price above the 200 EMA)
- MACD histogram is forming red bars (correction)
- When histogram bars start shrinking and a green bar appears → BUY
- This is a pullback buying strategy which is very effective
❌ Mistake 1: Relying only on MACD
MACD is a lagging indicator. Always confirm it with another indicator (RSI, Volume).
❌ Mistake 2: Using MACD in a Choppy Market
In sideways or range-bound markets, MACD gives many false signals. Confirm the trend first.
❌ Mistake 3: Not Using a Stop Loss
No indicator is 100% accurate. Always use a stop loss.
| RSI | Overbought/Oversold | Measures momentum differently |
| Bollinger Bands | Volatility | Shows price range |
| Moving Average | Trend direction | Only trend, not momentum |
| MACD | Both Trend + Momentum | All-in-one signal |
⚖️ Compare Exchanges: Check out the Exchange Compare Tool to trade MACD signals on a low-fee exchange.
Q1. On which timeframe does MACD work best?
MACD gives the most reliable signals on Daily (1D) and 4-Hour (4H) charts. 1-minute or 5-minute charts have too much noise.
Q2. Is MACD suitable for crypto trading?
Absolutely! MACD is just as effective in crypto as it is in stocks. MACD captures the volatile moves of Bitcoin and Ethereum very well.
Q3. How reliable is MACD divergence?
Divergence is a very powerful signal, but it may take some time for the reversal to arrive. Combine it with volume or RSI for confirmation.
Q4. How to change MACD settings?
Add the MACD indicator to your chart on TradingView or your exchange. Click on the settings icon and customize the 12, 26, 9 values.
MACD is a versatile and reliable indicator that:
- ✅ Is very effective in trending markets
- ✅ Can catch reversals using divergence signals
- ✅ Becomes even more powerful when combined with RSI and Volume
- ❌ Should be avoided in sideways/choppy markets
Pro Tip: Always check MACD on a higher timeframe first. Then refine your entry on a lower timeframe. This multi-timeframe approach significantly increases accuracy.
⚠️ Disclaimer: This article is for educational purposes only. Make any trading decision after your own research.
🧮 Interactive Tools: Try our free Crypto Tax Calculator and Crypto SIP Calculator for your portfolio calculation and tax estimation.