What Are Bollinger Bands? — Complete Guide
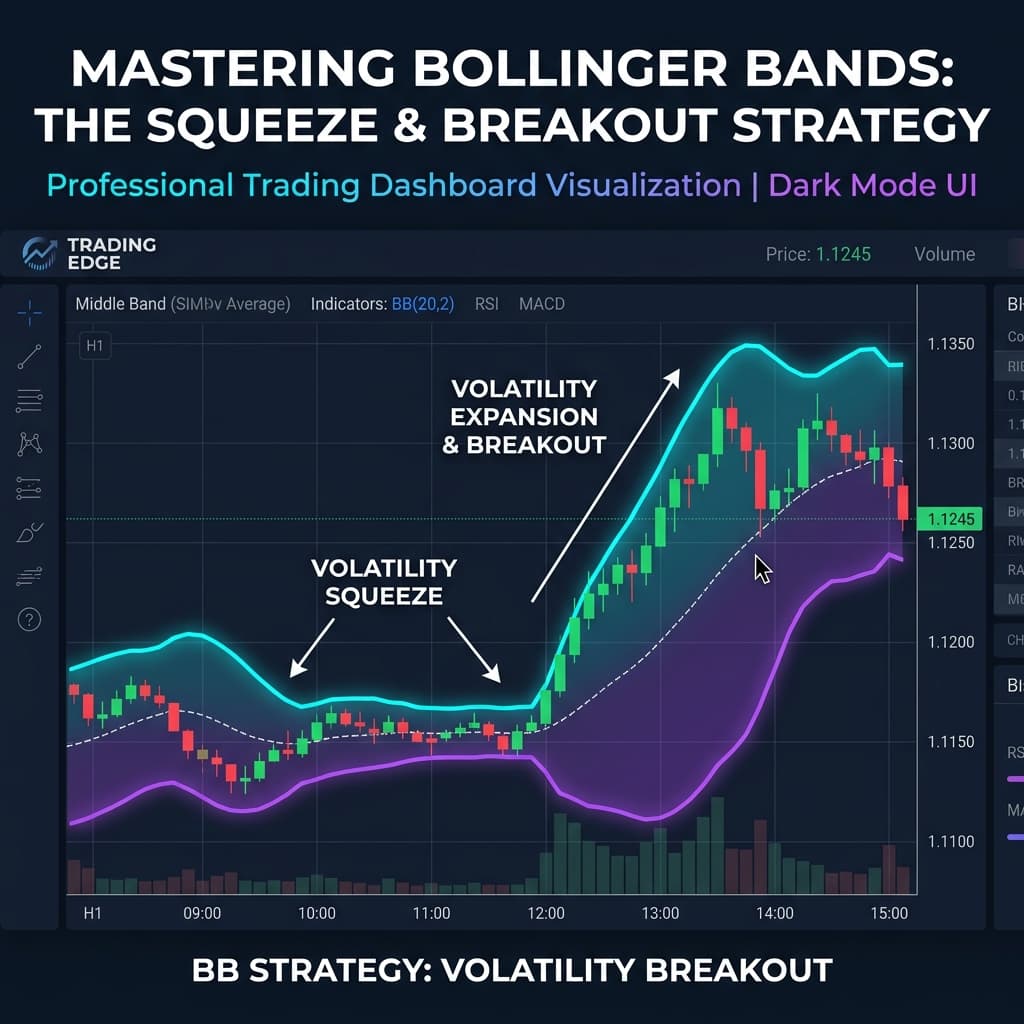
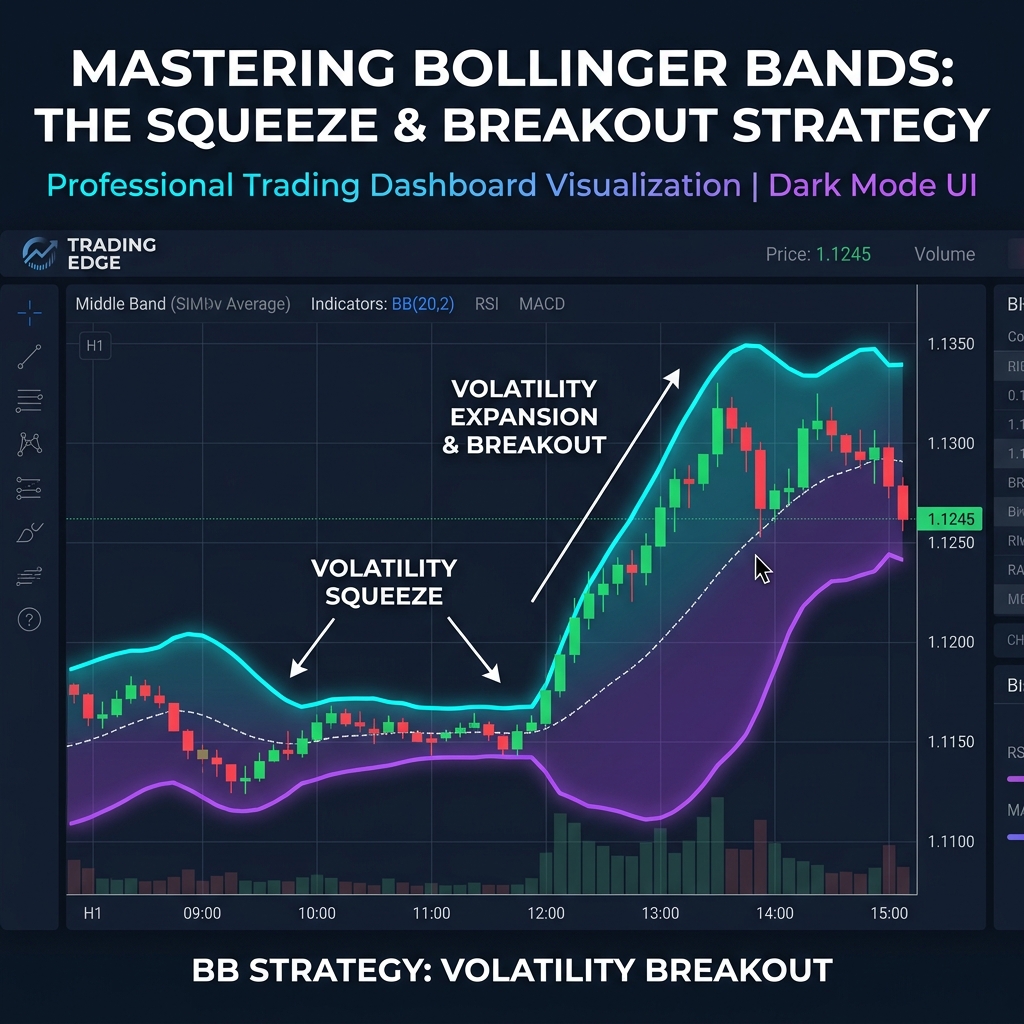
Bollinger Bands is a volatility-based indicator developed by John Bollinger in the 1980s. It consists of three lines that form a "band" or channel around the price. When the market is volatile, the bands widen; when the market is quiet, the bands narrow (squeeze).
📊 Track Live Volatility: Check real-time price volatility on the Live Crypto Prices Tool.
The Structure of Bollinger Bands
Three Lines:
| Upper Band | 20 SMA + (2 × Standard Deviation) | Resistance / Overbought zone |
| Middle Band | 20-period Simple Moving Average | Trend direction |
| Lower Band | 20 SMA − (2 × Standard Deviation) | Support / Oversold zone |
Standard Settings: Period = 20, Deviation = 2
Statistically, the price remains between the Upper and Lower bands 95% of the time. When the price goes outside the bands, it represents an extreme move.
Key Concepts of Bollinger Bands
1. Bollinger Squeeze (The Most Important Signal)
When the Upper and Lower bands come very close to each other (become narrow), it is called a Bollinger Squeeze.
What a Squeeze Means: Low volatility is prevailing in the market — a big move is coming!
Identifying the direction of the breakout after a squeeze yields higher profits:
- Breaks the upper band → Bullish breakout
- Breaks the lower band → Bearish breakdown
2. Bollinger Expansion (Breakout Confirmation)
When the bands suddenly widen and the price makes a strong move in one direction:
- It confirms that a new trend has started
- Volume should also increase along with the breakout
3. Price Walking the Bands
In a strong trend, the price stays consistently near the Upper Band (Bullish) or the Lower Band (Bearish) — this is called "walking the bands".
Bollinger Bands Trading Strategies
Strategy 1: Bollinger Squeeze Breakout (Best Strategy)
Steps:
- Add Bollinger Bands to the chart (20, 2)
- Identify a squeeze — the bands have become very narrow
- Also add a volume indicator
- When the price breaks above the Upper Band WITH high volume → BUY
- When the price breaks below the Lower Band WITH high volume → SELL/SHORT
- Stop Loss: Outside the opposite side of the band
- Target: Expect a move equal to the band width
Strategy 2: Mean Reversion (Bounce Trading)
This strategy works best in a range-bound market:
BUY Setup:
- Price touches or breaks the Lower Band
- A bullish reversal candle forms (Hammer, Engulfing)
- RSI is in the 30-40 zone
- Entry: Above the candle close
- Target: Middle Band (20 SMA)
- Stop Loss: Below the Lower Band
SELL Setup:
- Price touches or breaks the Upper Band
- A bearish reversal candle forms (Shooting Star, Bearish Engulfing)
- RSI is in the 60-70 zone
- Entry: Below the candle close
- Target: Middle Band (20 SMA)
Strategy 3: Bollinger Bands + MACD Combination
| Price bounce from Upper Band + MACD Bearish crossover | SELL |
| Price bounce from Lower Band + MACD Bullish crossover | BUY |
| Price Squeeze + MACD zero line cross | Breakout entry |
⚖️ Select an Exchange: Trade the Bollinger strategy on a low-fee platform — Exchange Compare Tool
Bollinger Bands Settings — Which One is Best?
| Scalping (5-15 min) | 10 | 1.5 | Fast signals |
| Swing (4H-Daily) | 20 | 2.0 | Standard, Most reliable |
| Position (Weekly) | 50 | 2.5 | Long-term trends |
❌ Mistake 1: Buying/selling as soon as the price touches the band
Touching the band is not a guarantee of a reversal. Wait for a confirmation candle.
❌ Mistake 2: Using the mean reversion strategy in a strong trend
If there is a strong bullish trend, buying at the Lower Band can be dangerous.
❌ Mistake 3: Ignoring volume
Volume is very important in a Bollinger Squeeze breakout. A low-volume breakout can fail.
Q1. What is the best timeframe for Bollinger Bands?
Bollinger Bands give the most accurate results on 4H and Daily charts.
Q2. How long can a Bollinger Squeeze last?
A squeeze can last anywhere from a few days to a few weeks. The longer the squeeze, the larger the expected breakout move.
Q3. Are Bollinger Bands effective for crypto trading?
Yes! Due to the high volatility of crypto, Bollinger Bands are very effective here — especially the squeeze breakout strategy.
Q4. Why use a Standard Deviation of 2?
Statistically, the price remains within the 2 standard deviation bands 95.4% of the time. This provides reliable overbought/oversold zones.
Bollinger Bands are a complete volatility toolkit:
- Detect big moves in advance using the Squeeze
- Take safe entries using Band touch + reversal candle
- Ride strong trends via Expansion
- Always confirm with volume and another indicator
⚠️ Disclaimer: Educational content only. Trading involves risk.
💡 Related Masterclass: Behtar confirmation aur trend direction samajhne ke liye hamara Moving Average (SMA & EMA) Trading Strategy Guide zaroor padhein.
🧮 Interactive Tools: Try our free Crypto Tax Calculator and Crypto SIP Calculator for your portfolio calculations and tax estimations.